The coalition of the outdoorsy: What exactly is included in the outdoor recreation economy, anyway?
One of the truisms of outdoor recreation economy advocacy is that before you say “outdoor recreation” in a crowded planning commission meeting, it helps to define it. Understandably, people’s minds go a lot of different places when they hear “outdoor recreation.” And those different places are the meat and potatoes of this week’s Bureau of Economic Activity report on the multi-faceted outdoor recreation economy.
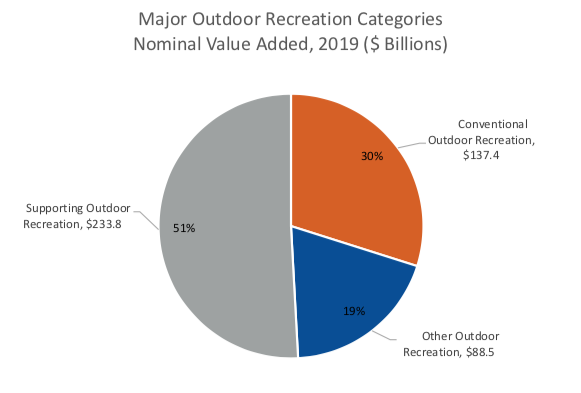
The full Monty headline is this — the outdoor recreation economy accounted for 2.1 percent ($459.8 billion) of current-dollar gross domestic product (GDP) for the nation in 2019. And to get to that $459.8 billion, there are 36 line items, including some specific ones like “kayaking” as well as some pretty random grab bags like “other Outdoor activities” which lumps in everything from disc golf to water polo.
There are loads of takeaways from the data. For me, the first one is that receipts matter. The BEA data doesn’t reflect participation or excitement or passion or contributions to public health or society, it just reflects stuff that can be seen from DC, the measurable direct and indirect expenditures that surround outdoor activities.
The second big takeaway for me is that participation cross referencing would be a huge asset to this data. For instance, the report ranks bicycling and recreational flying as having the same general economic impact, but — unless there are a lot more glider pilots out there than I know — one has a much more broad-based, high population impact. That type of data linkage between economic impact and consumer participation could ideally show a correlation between increases/decreases in economic impact and increases/decreases in participation. And once we get there, we’d then be a big step closer to the holy grail metric that links together outdoor recreation, economic impact and public health outcomes.
And so without further ado … here is your 459.8 billion outdoor industry (btw, all terminology is directly lifted from categories reflected in the BEA report).
$63.9 billion: Transportation (50+ miles)
$47.3 billion: Lodging (50+ miles)
$45.2 billion: "Conventional” Multi-use Apparel and Accessories (Consists of backpacks, bug spray, coolers, general outdoor clothing, GPS equipment, hydration equipment, lighting, sports racks, sunscreen, watches, and other miscellaneous gear and equipment.)
$39 billion: Local Trips and Travel (Trip expenses less than 50 miles away from home, including food and beverages, lodging, shopping and souvenirs, and transportation.)
$25.6 billion: Food and Beverages (expenses from trips MORE than 50 miles away from home)
$24.7 billion: Shopping and Souvenirs (expenses from trips MORE than 50 miles away from home)
$20.7 billion: State and Local Government expenditures
$18.7 billion: Game Areas (includes Golfing and Tennis)
$18.5 billion: RVing
$16.9 billion: Other Boating
$16.3 billion: Festivals/Sporting Events/Concerts
$14 billion: Amusement Parks/Water Parks
$10.3 billion: Other Outdoor Recreation Activities (Consists of agritourism, augmented reality games, beachgoing, disc golf, hot springs soaking, kite flying, model airplane/rocket/UAV, paintball, photography, stargazing/astronomy, swimming, therapeutic programs, water polo, yard sports.)
$9.2 billion: Motorcycling/ATVing
$8.9 billion: Construction
$8.6 billion: Equestrian
$8,3 billion: Air and Land Guided Tours/Outfitted Travel
$7.3 billion: Productive Activities (includes Gardening)
$6.9 billion: Other Conventional Air and Land Activities (Consists of air sports, driving for pleasure, geocaching/orienteering/rock hounding, ice skating, inline skating, land/sand sailing, races, running/walking/jogging, skateboarding, and wildlife watching/birding.)
$5.8 billion: Water Guided Tours/Outfitted Travel (includes Boating and Fishing Charters)
$4.9 billion: Fishing (excludes Boating)
$4.8 billion: Hunting/Trapping
$4.5 billion: Shooting (includes Archery)
$4.2 billion: “Other" multi-use Apparel and Accessories (Consists of backpacks, bug spray, coolers, general outdoor clothing, GPS equipment, hydration equipment, lighting, sports racks, sunscreen, watches, and other miscellaneous gear and equipment.)
$3.5 billion: Climbing/Hiking/Tent Camping
$3.4 billion: Field Sports
$3.2 billion: Federal Government expenditures
$2.5 billion: Other Conventional Water Activities (Consists of boardsailing/windsurfing, SCUBA diving, snorkeling, stand-up paddling, surfing, tubing, wakeboarding, water skiing, and whitewater rafting.)
$2.4 billion: Other Snow Activities (includes Snowmobiling) (Consists of dog mushing, sleighing, snowmobiling, snow shoeing, snow tubing.)
$2 billion: Skiing
$2 billion: Bicycling
$1.8 billion: Snowboarding
$1.4 billion: Recreational Flying
$1.3 billion: Sailing
$329 million: Kayaking
$89 million: Canoeing
###
